One patient-shaped table
Rows are participants; columns are variables. A blank follow-up value is missing, not “no event”.
Software first contact
A Python-first introduction to Positron: one polyglot workspace for code, data, plots and reproducible statistical work.
Use this optional on-ramp if you are moving from notebooks, VS Code or RStudio. Start in Python, see how R fits the same workspace, and be ready for Jennifer’s Analysis Step 01.
Your short software on-ramp
This is not a separate statistics course. It teaches only the software moves needed to open the shared cohort, run a saved instruction and recognise a correct result.
Before you start: no software knowledge is required. This page prepares the statistics desk; it does not teach the whole analysis. You need access to Positron and permission to save the teaching files in one folder. Read Jennifer’s fictional study background before beginning Step 01.
By the end you can
1 · Purpose
Positron is a data-science IDE built for Python and R. It brings a professional code editor together with interactive consoles, variables, plots, notebooks, Quarto and a Data Explorer, so exploratory work and a saved analytical record can stay together.
Coding Polyglot: Python is the primary language in this on-ramp, but Positron is deliberately not a Python-only tool. Statisticians can use first-class R support in the same workspace, while Code OSS extensions add languages such as SQL, JavaScript, C++ or Rust when a project needs them.
The safe mental model is data + saved code → session objects + inspectable output. The Console and Variables pane are live working memory; the saved script is the reproducible record.
Rows are participants; columns are variables. A blank follow-up value is missing, not “no event”.
Menus can help you discover a procedure, but the commands or script make the work inspectable and repeatable.
Tables, estimates, intervals, warnings and plots are results, not a substitute for the saved analysis instructions.
2 · Open or access it
Positron Desktop is available for Windows, macOS and Linux. Use an institutionally managed installation if one is provided; otherwise download the current desktop release from Posit.
Prefer R? Select an R interpreter instead and use the supplied R script without leaving Positron. The editor, Variables pane, plots and Data Explorer serve both languages.
3 · Find the statistics desk
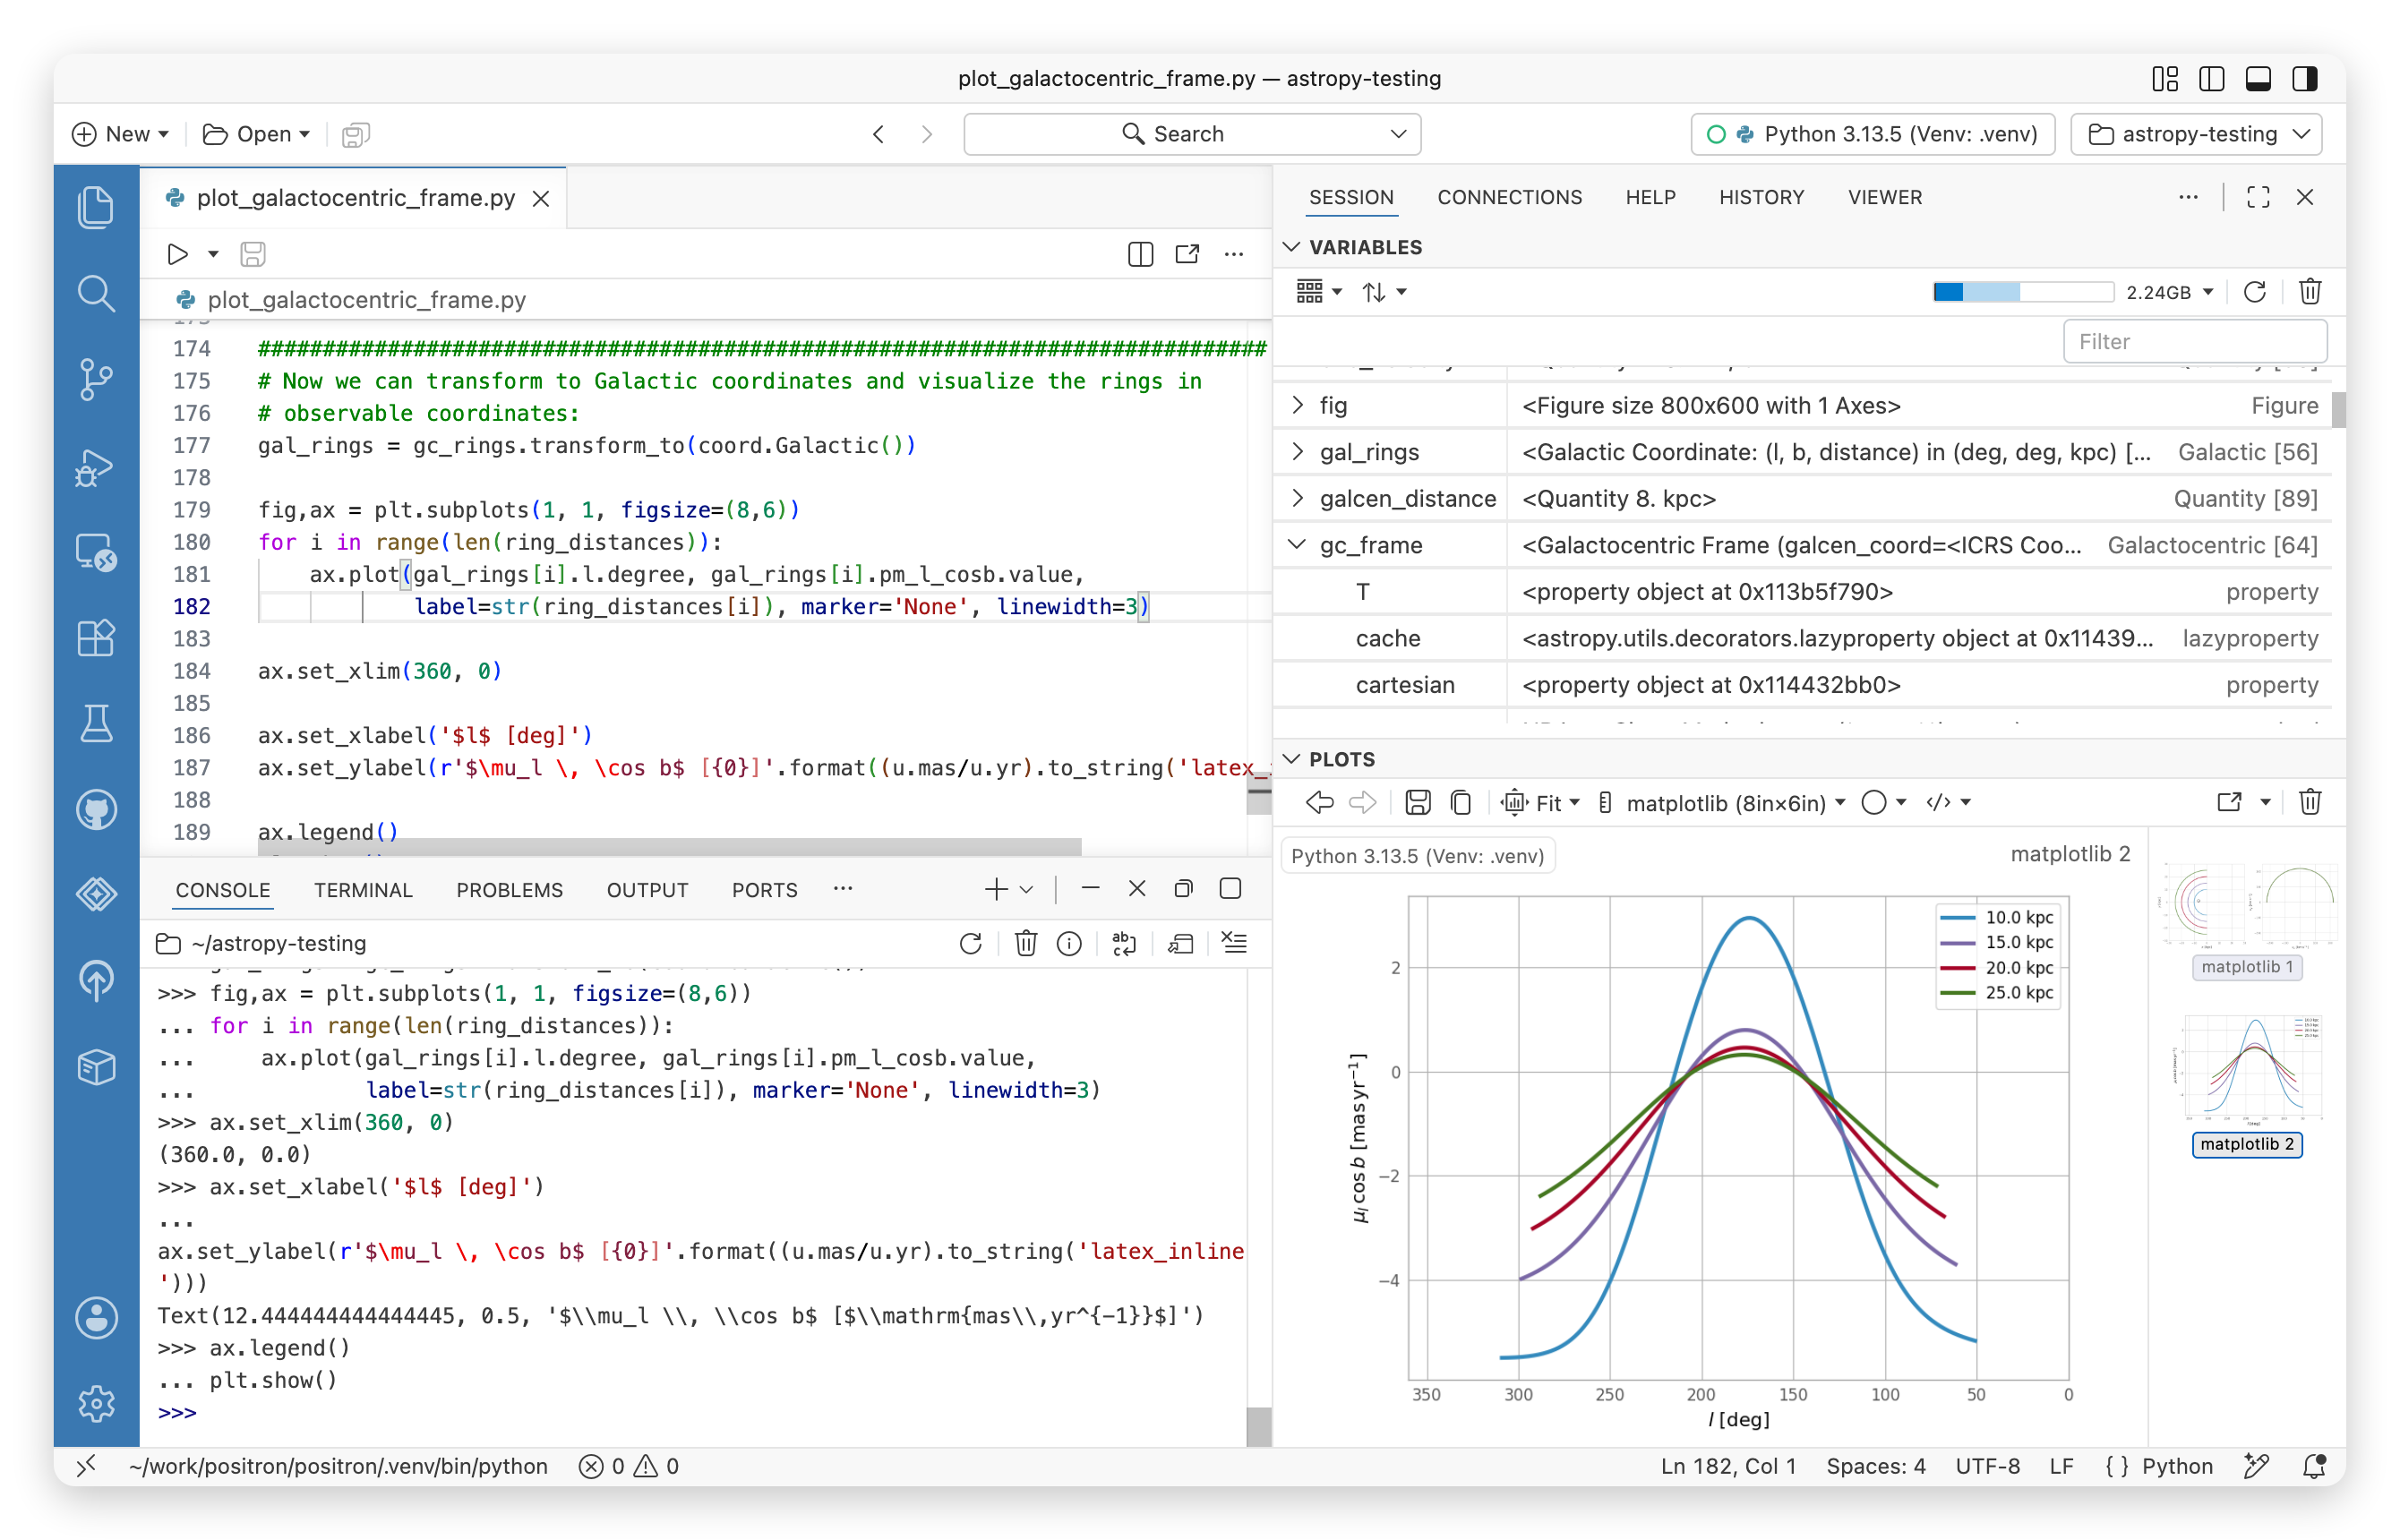
Write and save Python, R, notebook or Quarto files. The filename tab and folder in the Title Bar show which analytical record you are changing.
Runs code in the active Python or R session and prints values, warnings and errors. Useful for exploration; temporary commands still belong in the saved script.
Inspect live objects, data frames and figures in the Secondary Side Bar without replacing the code that created them.
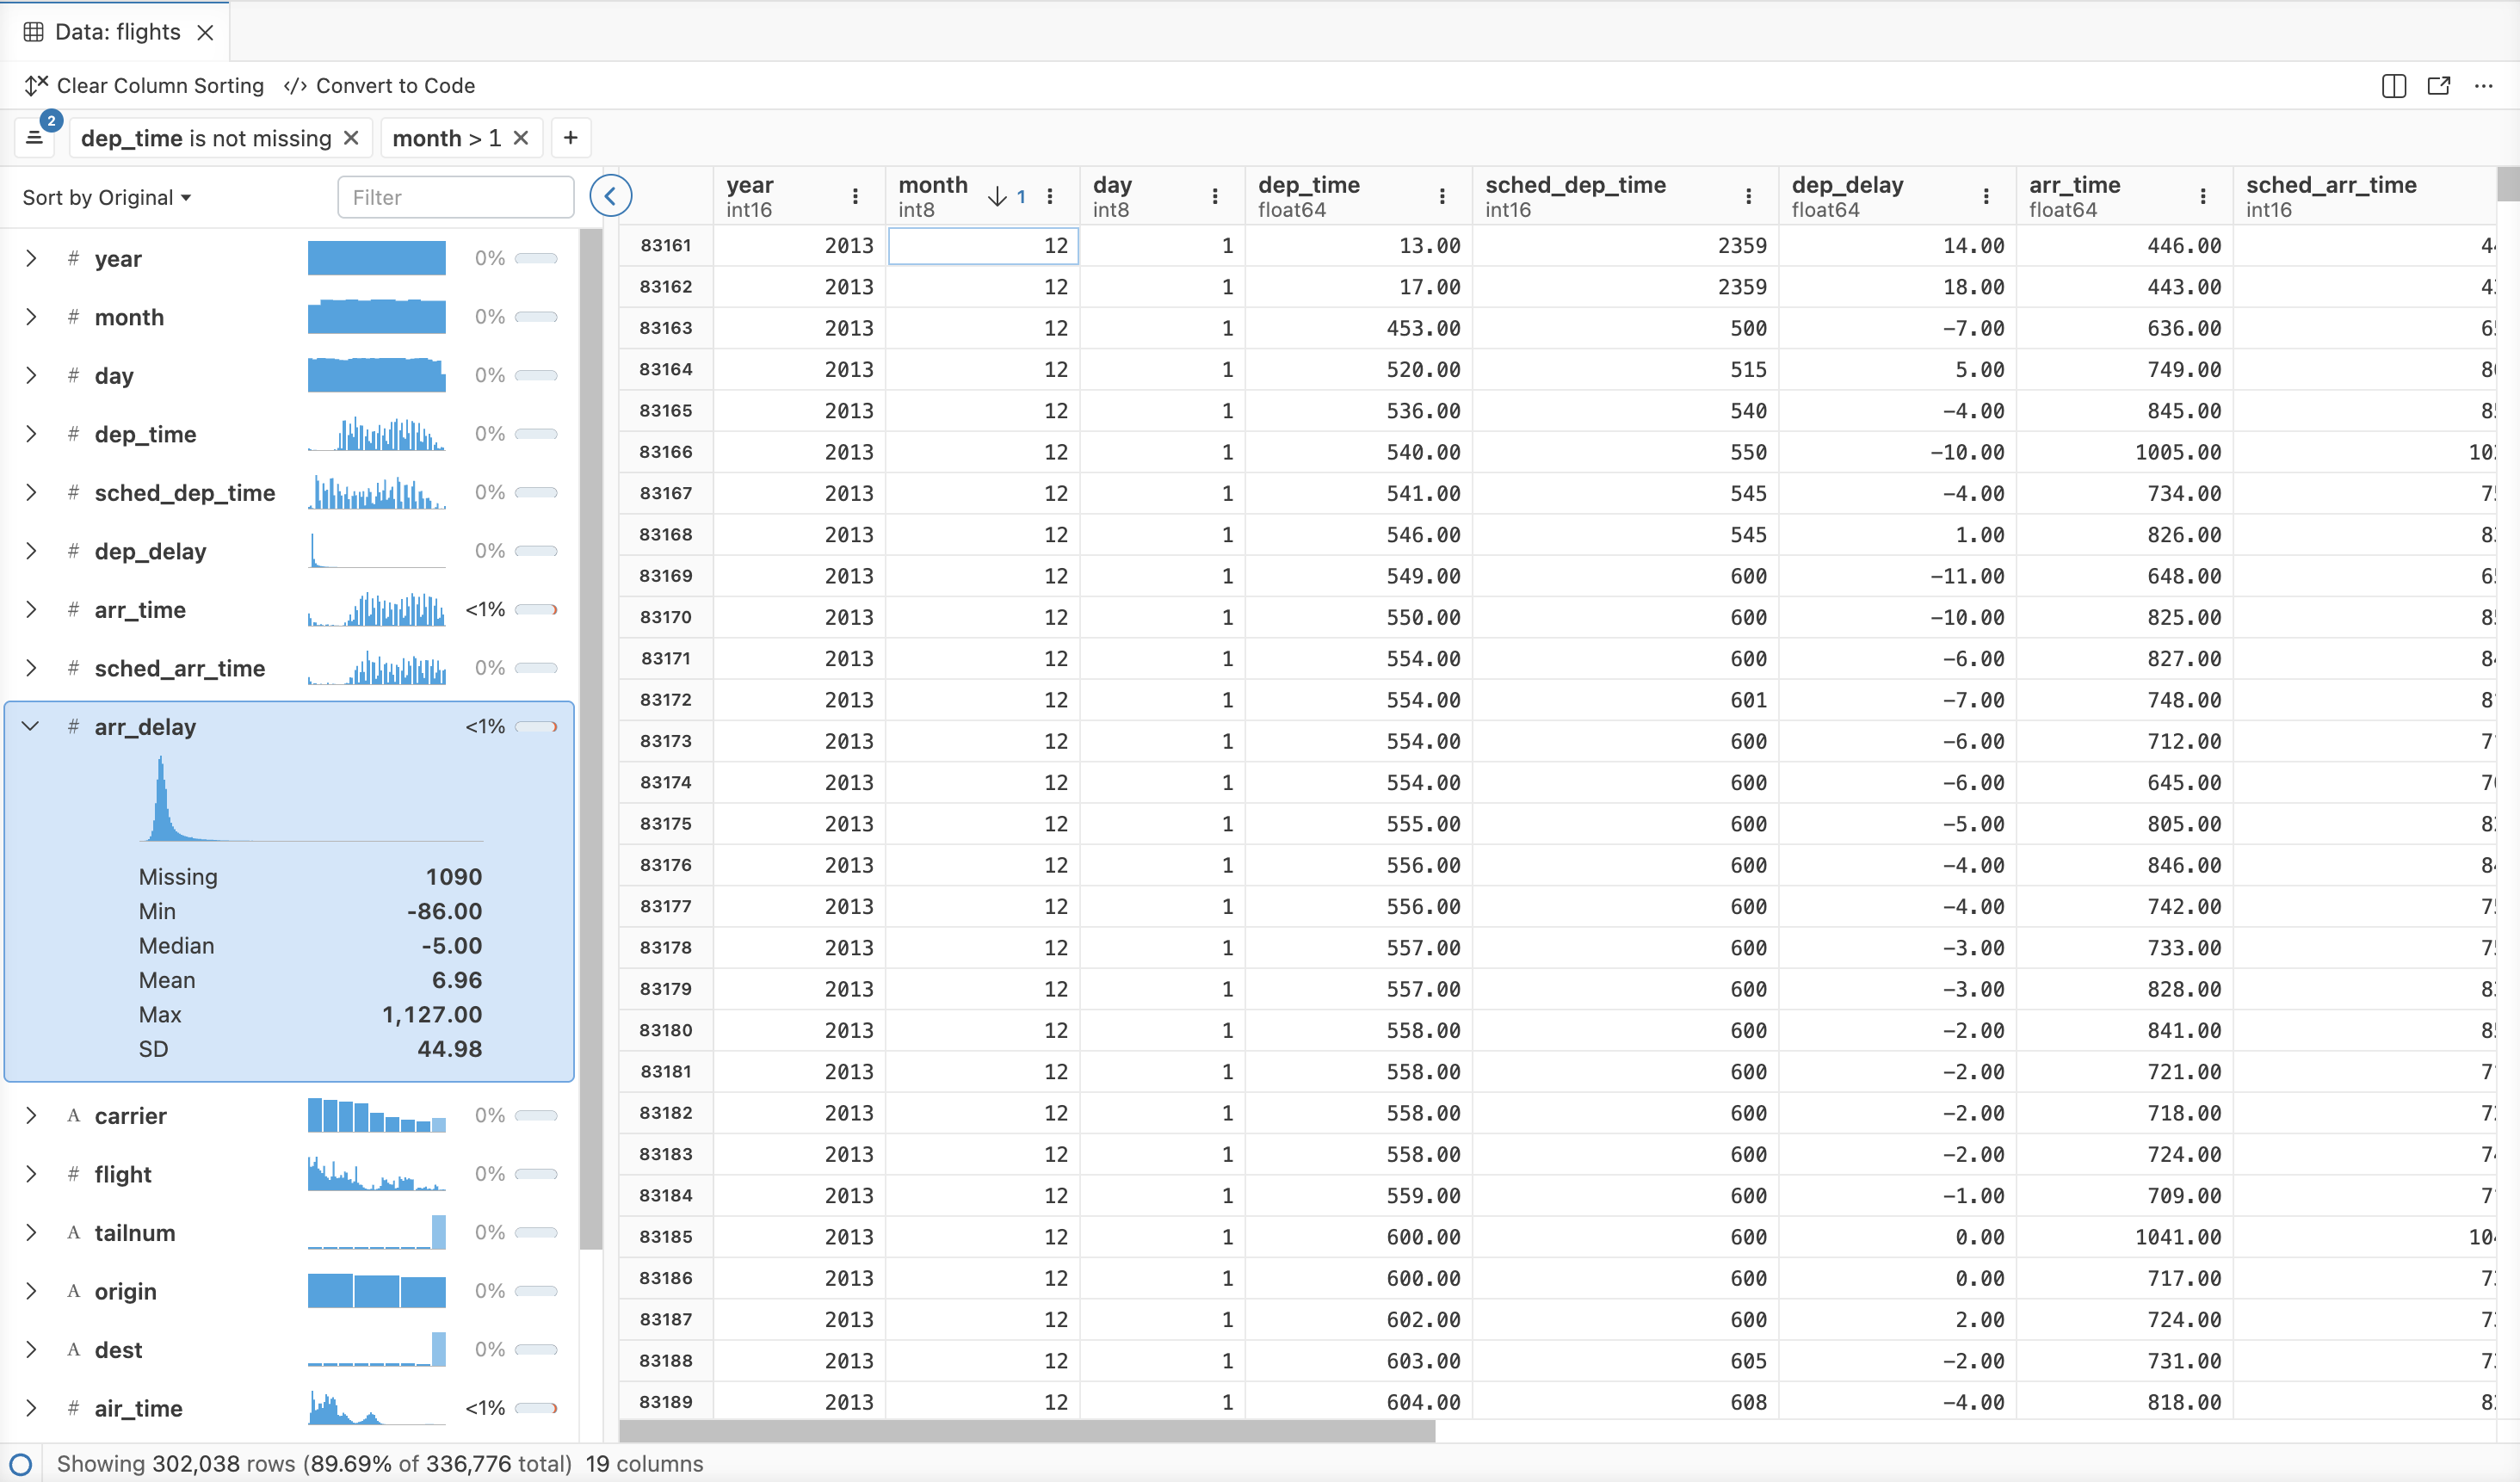
Open CSV, Parquet or in-memory data frames in a grid with temporary filters, sorting and column summaries.
4 · First reproducible run
Put the supplied .py file and CSV in one folder, then
open that folder in Positron. Open the Python file and run it with
the Run action or Ctrl+Enter on Windows/Linux and
Cmd+Enter on macOS.
This block uses pandas to create a data frame named
cohort, check its shape and answer the same medication-
review and age-summary questions as the other on-ramps. Select
cohort in Variables afterwards to open it in the Data Explorer.
import pandas as pd

cohort = pd.read_csv("gerostats_medication_review_cohort.csv")
counts = cohort["med_review"].value_counts().sort_index()

print("shape:", cohort.shape)
print("medication review counts:")
print(counts.to_string())
print("medication review percentages:")
print((counts / len(cohort) * 100).round(1).to_string())
print("age summary:")
print(cohort["age_years"].agg(["mean", "min", "max"]).round(2).to_string())The checked first-contact script shown on this page.
Download the .py fileThe same entirely synthetic, software-neutral data used by every desk.
Download the CSVUse the complete R script in the same polyglot workspace.
Download the R file5 · Successful output
Expected result
shape: (720, 16)
medication review counts:
med_review
0    517
1    203
medication review percentages:
med_review
0    71.8
1    28.2
age summary:
mean    78.35
min     65.00
max     96.00
Values 0 and 1 are codes, not yet
reader-friendly labels. The display confirms that Python read the
same 720-row fictional cohort used by the other software desks; it
does not test whether medication review changed an outcome.
6 · First-run problems
ModuleNotFoundError: pandasCheck the selected Python interpreter, then install pandas into that environment from the Packages pane or the integrated Terminal.
Use the interpreter selector in the Top Bar. Select an existing supported Python installation or follow Positron’s prompt to install one.
FileNotFoundErrorOpen the folder containing both the script and CSV, and keep the supplied filename unchanged. Do not rely on an unrelated working directory.
Stop. Re-download the shared CSV and rerun the script in a fresh session before interpreting any statistic.
Optional references for software detail, epidemiological methods and reproducible health-research reporting. You do not need these to begin Step 01.
Install the IDE, understand who it is for and orient yourself to its data-science workflow.
Open the Positron guideInterpreters, language support, formatting, magics, debugging and plots for Python work.
Read the Python guideUse the grid, column summaries and temporary filters without replacing saved code.
Open the Data Explorer guideFirst-class R sessions, familiar shortcuts and debugging for statisticians working in the same IDE.
Read the R guideOn-ramp complete
You can open the shared data, run saved instructions and recognise a correct first result. Continue to Jennifer’s Analysis Step 01, where you will check the study design, timeline, variables and whether the file matches the fictional study.