One patient-shaped table
Rows are participants; columns are variables. A blank follow-up value is missing, not “no event”.
Software first contact
New to RStudio? Find the project, script, data and output, then run one checked block with the shared cohort.
Use this optional on-ramp when the statistics desk is new. You will open the common cohort, run one saved block and be ready for Jennifer’s Analysis Step 01.
Your short software on-ramp
This is not a separate statistics course. It teaches only the software moves needed to open the shared cohort, run a saved instruction and recognise a correct result.
Before you start: no software knowledge is required. This page prepares the statistics desk; it does not teach the whole analysis. You need access to RStudio and permission to save the teaching files in one folder. Read Jennifer’s fictional study background before beginning Step 01.
By the end you can
1 · Purpose
R is the statistical language; RStudio is the desktop or browser environment used to write, run and organise R. In medical research, this pairing supports transparent data checking, epidemiological tables, regression, survival analysis, graphics and reproducible reporting.
The safe mental model is data + script → objects + output. The Environment pane is temporary. A fresh R session should be able to recreate every object from the saved script and unchanged data.
Rows are participants; columns are variables. A blank follow-up value is missing, not “no event”.
Menus can help you discover a procedure, but the commands or script make the work inspectable and repeatable.
Tables, estimates, intervals, warnings and plots are results, not a substitute for the saved analysis instructions.
2 · Open or access it
R is free. RStudio Desktop is also available without charge; some universities provide RStudio through Posit Workbench in a browser. Use the institutionally supported route if one is available.
.Rproj. Its name should appear at the top right before you run the script.R and RStudio are different programs. If RStudio says it cannot find R, install or select the R engine before troubleshooting the analysis.
3 · Find the statistics desk
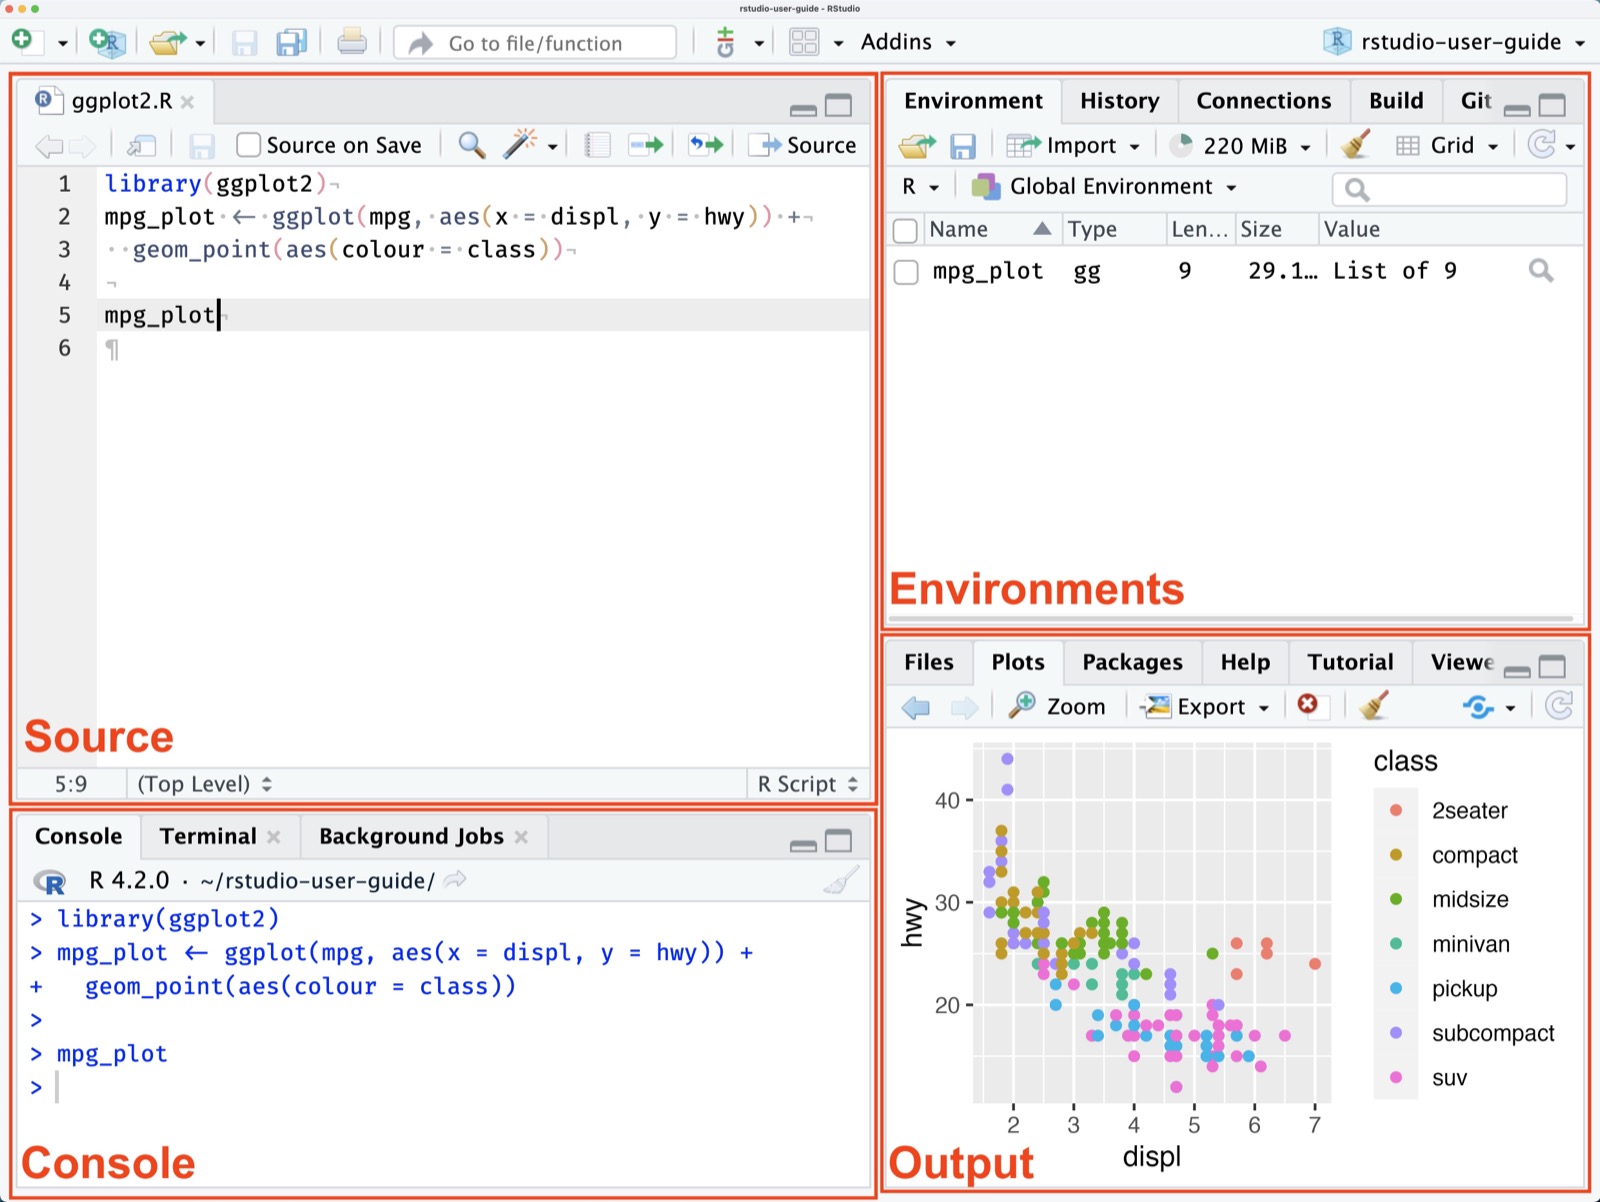
Write and save .R scripts. Run the current line or selection with Ctrl+Enter, or Cmd+Enter on macOS.
Shows commands as they execute and prints results, warnings and errors. It is temporary, not the analysis record.
Lists objects currently in memory. Useful for orientation; the script should be able to recreate all of them.
Files, plots, packages, help and the Viewer appear in tabs here.
4 · First reproducible run
Put the .Rproj, supplied .R script and CSV
in one folder. Open the project, then open the script in Source.
Run the block below with Ctrl+Enter on Windows/Linux
or Cmd+Enter on macOS.
The code creates an object named cohort, checks its
shape, and answers the same two questions as the Stata and SPSS
on-ramps: medication-review frequency and the cohort’s age summary.
cohort <- read.csv(
  "gerostats_medication_review_cohort.csv",
  na.strings = c("", "NA")
)

dim(cohort)
table(cohort$med_review, useNA = "ifany")
round(prop.table(table(cohort$med_review)) * 100, 1)
c(
  mean = mean(cohort$age_years),
  min = min(cohort$age_years),
  max = max(cohort$age_years)
)Use its opening block now; later sections match the guided medical-statistics journey.
Download the .R fileA clean project configuration with workspace saving disabled.
Download the .Rproj file5 · Successful output
Expected result
[1] 720  16

  0   1
517 203

   0    1
71.8 28.2

    mean      min      max
78.34722 65.00000 96.00000
Values 0 and 1 are codes, not yet
reader-friendly labels. Step 01 keeps the raw field auditable and
adds labels for interpretation. These summaries describe the cohort;
they do not test an effect of medication review.
6 · First-run problems
cannot open fileThe CSV is not in the project folder or its filename differs. Confirm the project name at top right and inspect the Files pane.
object 'cohort' not foundThe import line did not run successfully. Run from the first line downward; later commands depend on the object it creates.
unexpected symbolCheck quotation marks, commas and closing parentheses. Run the supplied block unchanged before editing it.
Stop. Re-download the shared CSV and make sure R read the comma-delimited file with the header row.
cohort..R file that recreates the analysis.Optional references for software detail, epidemiological methods and reproducible health-research reporting. You do not need these to begin Step 01.
Keep health-study data, scripts and outputs together and recreate analysis from source.
Open the RStudio guideObjects, data frames, factors, tables, models and graphics in the official R manual.
Read the R manualFunctions and documentation for applied epidemiological data analysis, rates and follow-up data.
Open the Epi package pageClinical examples covering displays, uncertainty, tests and study design; the free online text is an older edition.
Open the BMJ referenceOn-ramp complete
You can open the shared data, run saved instructions and recognise a correct first result. Continue to Jennifer’s Analysis Step 01, where you will check the study design, timeline, variables and whether the file matches the fictional study.