One patient-shaped table
Rows are participants; columns are variables. A blank follow-up value is missing, not “no event”.
Software first contact
New to SPSS? Find the data, saved instructions and output, then run one checked block with the shared cohort.
Use this optional on-ramp when the statistics desk is new. You will open the common cohort, run one saved block and be ready for Jennifer’s Analysis Step 01.
Your short software on-ramp
This is not a separate statistics course. It teaches only the software moves needed to open the shared cohort, run a saved instruction and recognise a correct result.
Before you start: no software knowledge is required. This page prepares the statistics desk; it does not teach the whole analysis. You need access to SPSS and permission to save the teaching files in one folder. Read Jennifer’s fictional study background before beginning Step 01.
By the end you can
1 · Purpose
IBM SPSS Statistics is well suited to labelled health-research data, descriptive tables, epidemiological comparisons and regression models. Its menus make procedures visible to a novice; its Syntax Editor turns those choices into an auditable analysis.
The safe mental model is data + syntax → output. Do not treat clicking OK, editing cells by hand or saving the Output Viewer as a reproducible analysis.
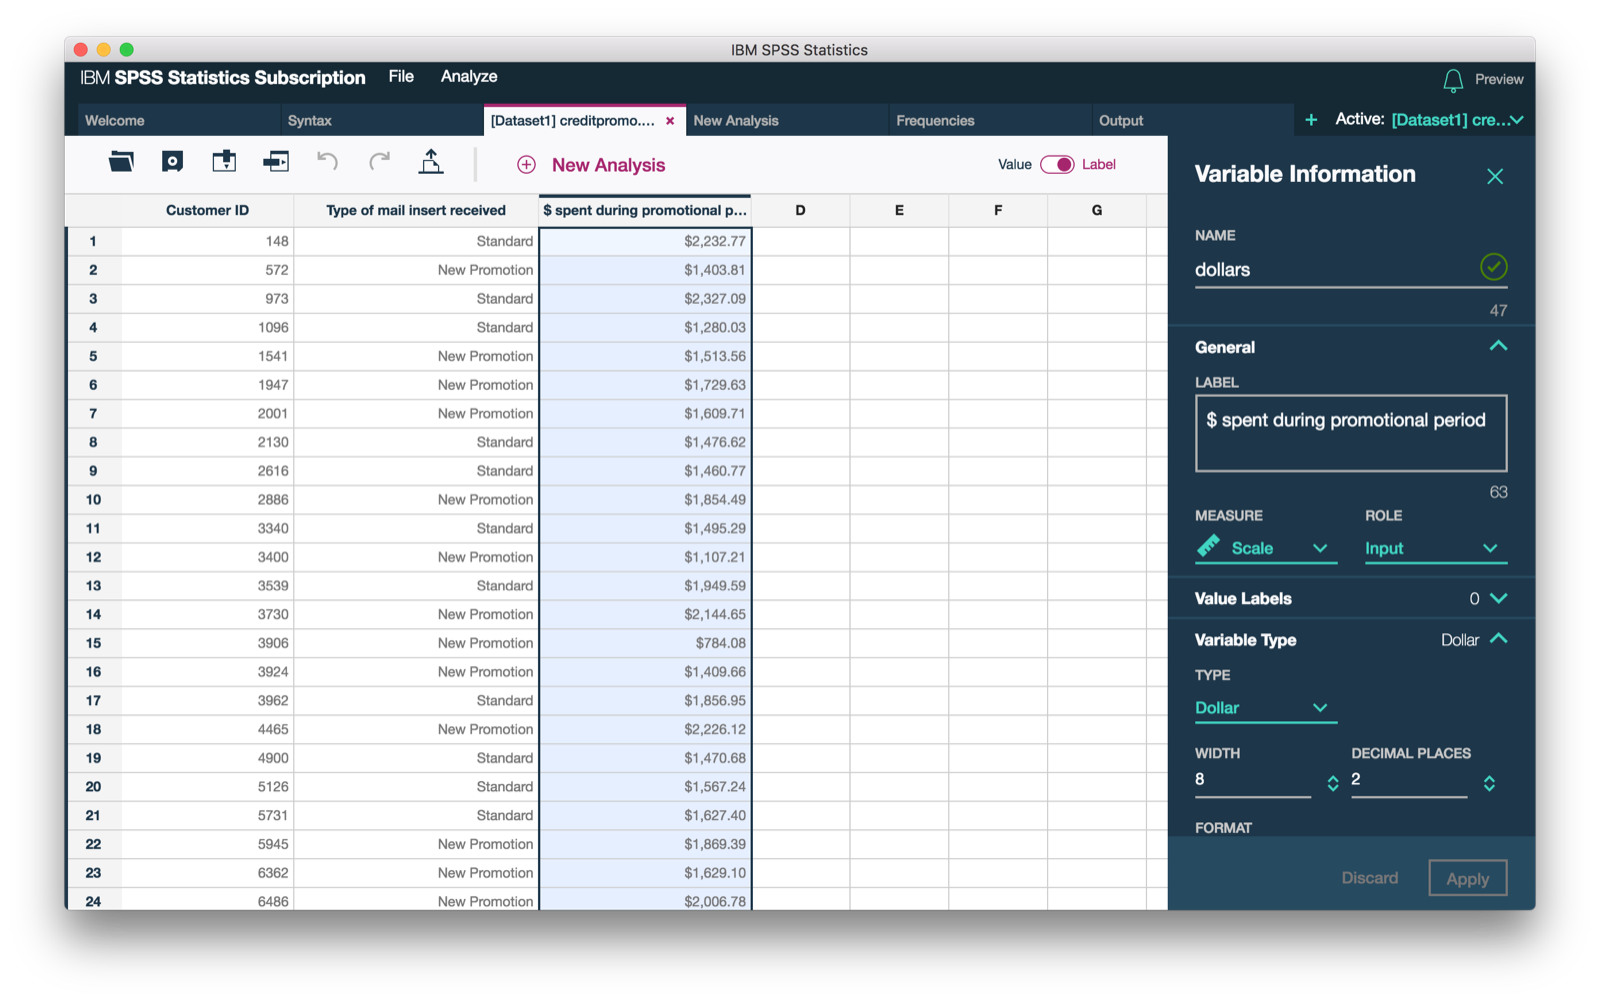
Rows are participants; columns are variables. A blank follow-up value is missing, not “no event”.
Menus can help you discover a procedure, but the commands or script make the work inspectable and repeatable.
Tables, estimates, intervals, warnings and plots are results, not a substitute for the saved analysis instructions.
2 · Open or access it
SPSS is licensed software. First check your university or employer software portal: you may be offered a managed desktop install, remote desktop or institutional licence. Use the version your organisation supports rather than buying a separate copy.
.sps file before the CSV..sps and CSV together. If your institution uses a remote desktop, place both files in a folder that session can reach.A licence or activation error is an access problem, not a statistics problem. Use your institution’s supported route or IBM’s official licence guidance in Go deeper.
3 · Find the statistics desk
Rows are cases and columns are variables. Use it to inspect values, not to make undocumented manual changes.
Names, labels, types, missing-value rules and measurement levels live here.
Tables, charts, warnings and model output appear here. Save it, but do not treat it as the analysis source.
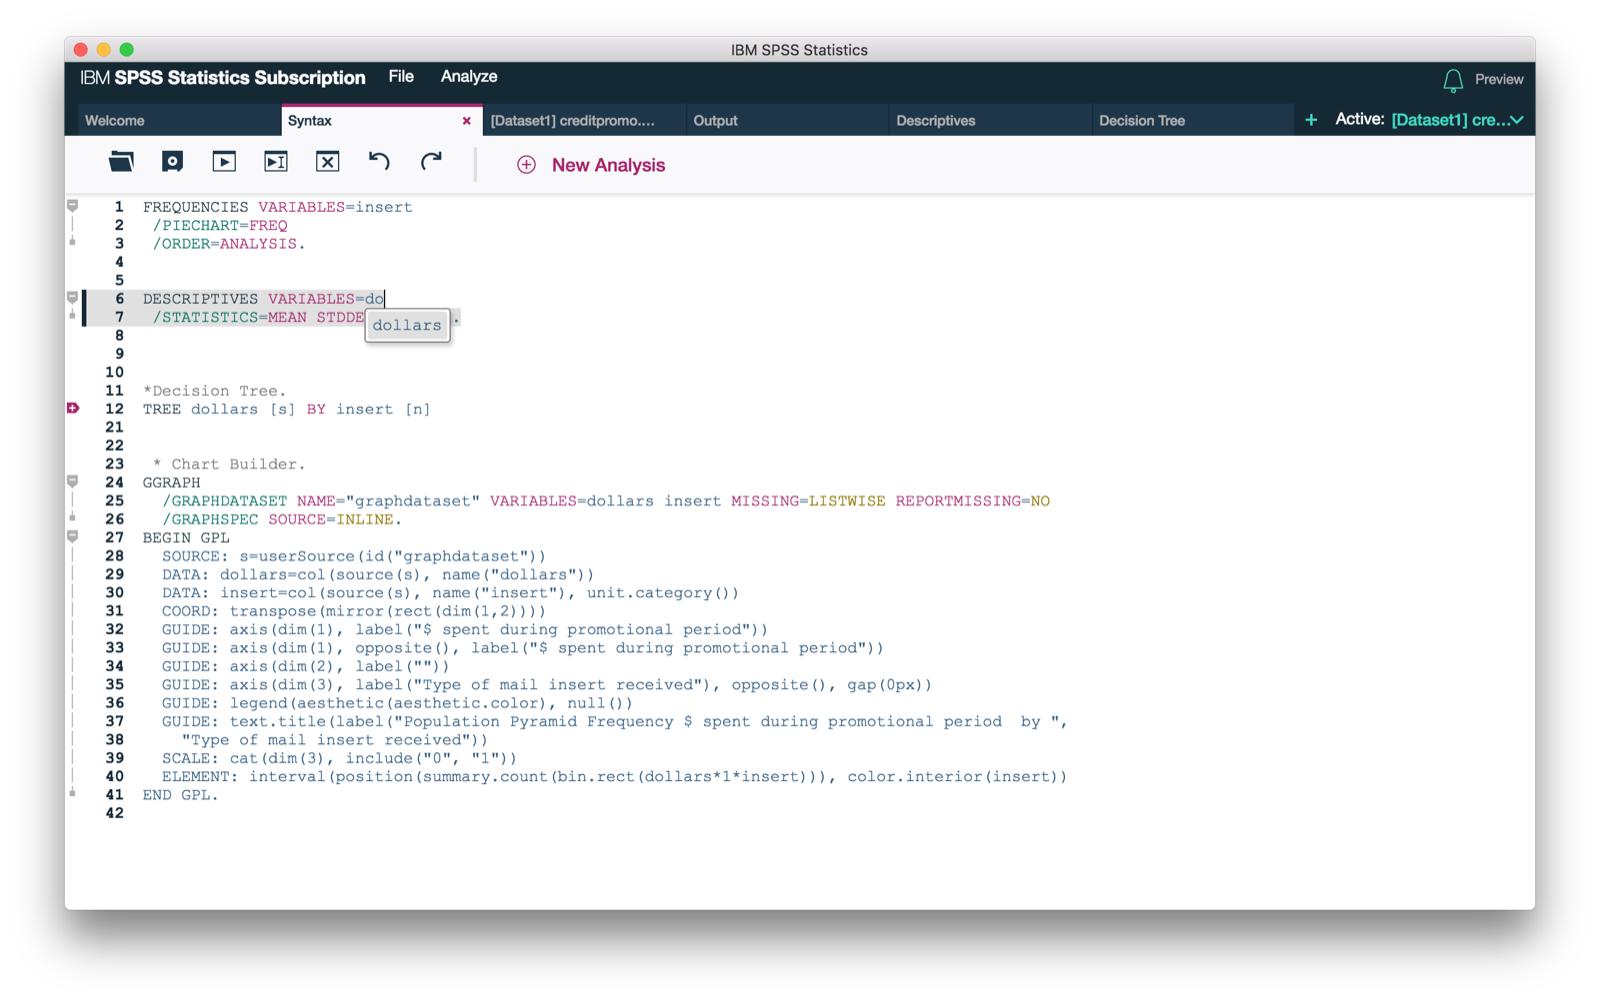
The reproducible record: import, labels, transformations, tests and models in executable blocks.
4 · First reproducible run
Download the CSV and complete .sps file into one
folder. Open the syntax file and run its complete
Section 1 import block first. If SPSS cannot find the
CSV, edit only the /FILE= path.
Then run the two commands below. Select whole commands, including their final full stops, and choose Run → Selection. They answer: “How many people received medication review?” and “What is the cohort’s mean and age range?”
* Run after Section 1 of the supplied syntax file.
FREQUENCIES VARIABLES=med_review
  /ORDER=ANALYSIS.

DESCRIPTIVES VARIABLES=age_years
/STATISTICS=MEAN MIN MAX.Use Section 1 now; later sections match the guided medical-statistics journey.
Download the .sps fileThe same software-neutral data used in all three routes.
Download the CSV5 · Successful output
Expected result
Read the frequency table before its chart or formatting. The count and percentage describe this synthetic cohort; they do not test whether review improved an outcome. That question comes later.
6 · First-run problems
The /FILE= path does not point to the CSV. Copy the full path, keep its quotes and rerun the entire GET DATA command.
Select from the command name through the final full stop. A partial command is not executable SPSS syntax.
Do not rely on the import wizard. Reopen the supplied syntax and run the complete typed import block from a clean session.
Stop. Missing follow-up is unknown, not “no event”. Reimport with the supplied definitions before calculating any denominator.
Optional references for software detail, epidemiological methods and reproducible health-research reporting. You do not need these to begin Step 01.
Desktop installation and licence activation. Use institutional instructions first when your university manages access.
Open IBM installation guidanceHow saved syntax jobs are opened, run and retained as the reproducible record.
Read the syntax-file guideCounts, row percentages, expected cells, chi-square and risk estimates for epidemiological tables.
Read CROSSTABS documentationClinical examples covering displays, uncertainty, tests and study design; the free online text is an older edition.
Open the BMJ referenceOn-ramp complete
You can open the shared data, run saved instructions and recognise a correct first result. Continue to Jennifer’s Analysis Step 01, where you will check the study design, timeline, variables and whether the file matches the fictional study.