In this chapter…
This chapter examines how survey concepts become measurements and how error can enter both representation and measurement.
By the end of this chapter, you should be able to…
- distinguish validity, reliability, bias and variability
- use the total survey error perspective to diagnose design risks
- balance quality, cost and practical constraints when planning a survey
In this chapter
By the end of this chapter, you should be able to:-
- distinguish between ‘errors’ and ‘mistakes’ in the context of quantitative social surveys;
- identify the key dimensions of quality in survey research;
- define what is meant by ‘validity’, ‘reliability’, ‘representativeness’, ‘freedom from bias’ in the context of survey research, and identify potential threats to these dimensions of quality.
Errors and mistakes in quantitative social surveys
As we have seen in Chapter 1, from a scientific viewpoint, survey research is concerned with measuring the attributes, behaviour etc. of human beings or other entities. Typically, the objective is to collect information from workers, employers, clients, patients, professionals or members of the general public on personal circumstances, behaviour, attitudes, expectations etc.
In collecting this information, we wish to minimise errors and mistakes. In ordinary conversation, of course, we use the words ‘mistake’ and ‘error’ to mean much the same thing. When talking about surveys, however, it helps to draw a distinction between these two terms. Certain features of surveys involve error without anyone having made a mistake. Examples are:
- Sampling variance, meaning the random variability which occurs when one takes a sample, rather than collecting data from the whole population; the results derived will vary from sample to sample and the extent of this variation is termed ‘sampling error’ (we will develop this topic further in Chapter 12);
- Sampling bias, which arises when the sampling method is such that the probability of being selected varies in an uncontrolled and unknown way between different population sub-groups (we will develop this topic further in Chapter 12);
- Non-response bias, which arises when some of those sampled are not contacted or decline to participate in the survey and the non-respondents differ, on average, from respondents in terms of characteristics or behaviour that the survey seeks to measure (we will develop this topic further in Chapter 10);
- Measurement error, which arises because humans are seldom entirely precise and consistent in the responses they give to survey questions (response variance) and may give responses that differ systematically from the truth (response bias) (we will develop this topic further in Chapter 6).
We try to minimise the error from these sources by good design and sound procedures, both in respect of the survey as a whole and of individual questions.
However, surveys can also be spoiled by mistakes such as oversights, misunderstandings etc. These may be committed by people doing routine tasks, but researchers and project managers should not think themselves immune (it is not unknown for a questionnaire to be sent out without adequate proof-reading, resulting in the omission of a number of questions!). Examples of the kind of mistakes that can be made are:-
- specification errors – that is, mismatch between the survey design and the survey aims;
- mistakes in computer programming and analysis;
- misunderstanding or overlooking instructions;
- mistakes in defining questionnaire routing;
- mistakes in word-processing, pagination etc;
- mistakes in copying numbers etc.;
- inadequate checking and proof-reading;
- mislaying documents.
We need to guard against these types of mistake by quality control systems incorporating:-
- adequate staff provision;
- good staff selection and training;
- good, on-going staff supervision and attention to staff motivation;
- good planning and record keeping;
- pre-specified, explicit, written procedures and protocols;
- fail-safe systems design;
- systematic checking of drafts etc;
- automatic checking of key counts and details.
Quality aims in survey research
The quality aims in quantitative surveys reflect the risks of error and mistakes (in the senses defined above) and the measures that must be taken to minimise error. The overall aim is to collect information and provide estimates that are:
- Sufficiently precise for their purpose (in other words, the margins of random uncertainty – the confidences limits – around a survey-based estimate are not so wide as to make the estimate unusable);
- Unbiased (in other words, the quantity or concept is not measured in a way that systematically under- or over-estimates the true value for sample members in general, or for particular sample members).
- Valid (in other words, is a ‘pure’ measure of the quantity or concept that is supposed to be measured and not distorted by other interfering variables);
- Reliable (in other words, measures the quantity or concept in a consistent or reproducible manner, without excessive random error);
- Discriminating (in other words, the measure can distinguish adequately between sample members who actually do differ to an important degree in terms of the variable measured);
- Free of mistakes and oversights.
The risk of survey information failing one of these tests is ever present. One common reason for such failure is that the design and size of the sample used is not adequate to give the required precision, or the method of selecting the sample is subject to bias.
Another common reason is that survey respondents, wishing to be polite, will often produce an answer even if they do not fully understand the question, or are unable or unwilling to answer it adequately and correctly (response error). Thus, for example, asking people whether they have ever suffered from ‘hyperchoriasis’ will produce many answers of ‘No’ and probably a few ‘Yes’ answers, but all must be invalid since this is an invented disease name. On the other hand, a single question asking respondents whether they have recently been ‘depressed’ may produce answers that are valid (in so far as the respondents understand what ‘depressed’ means and are prepared to reveal the information), but are unreliable, since the wording is vague and their current mood tends to affect what they say, or are inconsistent between respondents, because they have different severity thresholds for defining ‘being depressed’.
Moreover, procedures or instruments that are reliable are not always or necessarily valid for their purpose. The question about ‘hyperchoriasis’ might well provide quite stable and reliable responses over time, particularly when aggregated across a set of respondents, even though those responses are invalid and represent only willingness to make a guess. Other questions may yield responses that are valid and reliable, but are not sufficiently discriminating. For example, asking people if they ever suffer from headaches, with a simple ‘yes / no’ response format would probably yield reasonably valid and reliable responses (most individuals know what ‘a headache’ means and can say whether they experience it from time to time; the answer given is not very likely to be influenced by current mood or circumstance). But if the aim is to group people according to how often they have headaches, the question as posed will have poor discriminatory power – it will only allow us to distinguish those who never get headaches from those who sometimes get headaches, but will not allow us to discriminate between those who have frequent headaches and those for whom a headache is a rare event or with respect to the severity of headaches.
Aspects of validity
As already noted, validity refers to whether the question is adequately measuring the construct or concept of interest. In practice complete invalidity is unlikely; what tends to happen is that responses to a question designed to measure an attribute or type of behaviour – say for example, whether the respondent ever has fits – are ‘infected’ and distorted by other factors, such as the desire to conceal a disability that might affect employment prospects.
There need not even be any intention to conceal or deceive; invalidity often arises because the wrong question has been asked for the purpose intended. Asking about qualifications obtained through full-time education may yield an invalid measure of formal qualifications held by an individual, since those obtained ‘on the job’ or through part-time education would be excluded. Similarly, if the aim is to measure a person’s experience of pain, asking about his or her use of analgesics would not be particularly valid, since factors other than the incidence and severity of pain influence consumption.
In assessing whether an individual question or set of questions is valid, a number of different aspects of validity need to be taken into account.
- Face validity - whether ‘on the face of it’ the question(s) are measuring what they are supposed to measure. Face validity is generally assessed informally, by having non-expert and untrained ‘judges’ (for example, colleagues, family or friends) examine the questionnaire to see whether the items look all right to them. For example, such judges might feel that the question ‘Have you been feeling low-spirited recently?’ was valid as a measure of depression. This opinion is worth having, since it indicates that ordinary people can comprehend a term such a ‘low-spirited’ – perhaps better than the term ‘depressed’. However, it is not a sufficient test of the validity of the question.
- Content validity - whether the choice of items and the relative importance given to each is appropriate in the eyes of those who have some knowledge of the topic area. This is best achieved by having the questionnaire critiqued by a panel of people knowledgeable about the topic, including members of the target population. This critique involves assessing whether the questionnaire covers everything it should and does not include extraneous matter. For example, the clinical concept of ‘depression’ covers other symptoms besides feeling low-spirited. However, favourable assessments of content validity do not in themselves guarantee that the measure will produce valid information.
- Construct validity - whether the results obtained using the questionnaire confirm expected statistical relationships, the expectations being derived from underlying theory. In drafting questions, we all make theoretical assumptions about how concepts are related to one another; we should test these assumptions explicitly. One of the most common ways of assessing construct validity is through known-group validity. This involves making comparisons across groups who would a priori (either on the basis of theory, or drawing on previous empirical evidence) be expected to yield different results. For example, if a questionnaire was designed to assess health status, one would expect people with diagnosed, chronic disease to have poorer scores than those with no known current illnesses. Similarly, since trends over a number of years have shown an inverse relationship between social class and smoking behaviour, one would expect to observe higher rates of smoking in respondents of lower socio-economic status. However, the evidence needs to be interpreted with care, as the general relationship may not hold for (say) elderly women.
- Another way of establishing construct validity is through multi-trait multi-method analysis (Campbell and Fiske, 1959). This is most appropriate in the assessment of the validity of scales designed to measure some state or trait (e.g. health status; job satisfaction). It involves administering more than one instrument which purport to measure similar domains (for example, SF-36 and Nottingham Health Profile as measures of ‘health status’) and examining the correlation between scores on the various instruments. Higher correlations between scores on domains measuring similar concepts, either within the one instrument or across instruments, and weaker correlations between domains measuring dissimilar traits are indicative of construct validity.
- Criterion validity - whether the question / questionnaire yields results which correspond with those obtained by another, ‘gold-standard’ method, applied simultaneously (concurrent validity) or which forecast a criterion value (predictive validity). For example, declared smoking status could be validated by a measurement of cotinine in the saliva or expired CO2. Like construct validity, criterion validity is assessed formally, using statistical techniques such as correlation. A major problem with assessing criterion validity, however, is a lack of appropriate ‘gold-standard’ measures, especially in relation to subjective phenomena such as attitudes and beliefs. In interviewer-administered surveys, it may be possible to validate responses to some questions by direct observation. Regardless of mode of administration, validation of responses to some questions through documentary records (e.g. exam performance, consultations with a doctor) may be possible.
- Freedom from absolute or relative bias – whether the question / questionnaire yields results which fairly reflect the distribution of some target variable in the population and in sub-populations. An example of absolute bias would be where a question or set of questions which may be valid in some senses as a measure of ‘disability’, is still be open to criticism because it gives too high or too low an estimate of the prevalence of disability, or yields a distorted distribution of severity of disability in the population. An example of relative bias would be where the questions obtained responses from elderly people which made them seem less disabled that younger people with similar objective incapacities. (Bias can also arise from faulty sampling methods or from non-response, but in this section we are talking about measurement or response bias.)
For a more detailed discussion of this topic, see Litwin (1995); Streiner and Norman (1989); Tulsky (1990).
Aspects of reliability
As already noted, reliability refers to whether the question or questionnaire is measuring things in a consistent or reproducible way. As with validity, there are a number of different approaches to measuring reliability:-
- Test-retest reliability - this is the most logically straightforward measure of reliability. It involves checking whether the same answer is obtained if the question is asked of the same individual at two points in time, during which period no real change has occurred in that individual in relevant respects. It is important to choose an interval between the two measurements that is long enough that respondents are not simply recalling and repeating their initial answer, but is not so long that real change may have taken place. In practice it is often difficult to apply a satisfactory test-retest check because of the difficulty of simultaneously satisfying both the ‘no recall effect’ and the ‘no real change’ conditions.
- Internal consistency - whether responses to questions measuring the same or a related concept are consistent with each other. The idea here is that all questions suffer from some degree of response unreliability, but that the degree of logical and conceptual consistency found between responses to questions designed to capture the same property of a subject (for example, satisfaction with managers’ inter-personal skills; physical function) provides an indication of the reliability of those responses. Using a carefully designed set of questions to measure a given concept also enables us to construct a more reliable measure. This is done by combining responses to the set of questions to produce an composite scale score. This procedure ‘distils out’ the consistent common strand of meaning, because of the tendency for random errors to cancel each other out. The internal consistency of the scale as a measuring instrument is then assessed using statistical measures based on how well the constituent items are correlated with each other.
- Within-rater (within-observer, within-interviewer) reliability and between-rater (between-observer, between-interviewer) reliability are special cases of test-retest reliability. The first refers to whether the same data collector or assessor (usually an interviewer in the context of questionnaire surveys, but in other contexts it could be a diagnostician or observer) obtains the same responses from a given individual on two occasions, given that no real change has occurred in the meantime. The second refers to whether two (or more) interviewers obtain the same responses from a given individual, given no real change.
The idea which links the ‘test-retest’ and the ‘internal consistency’ conceptions of reliability is random measurement error. If a method of measuring some attribute is subject to much random error, the results of applying it on separate occasions will tend to diverge (in a random way). Similarly, if two measures of the same attribute are each affected by random error, they will also produce results which diverge in a random way.
For a more detailed discussion of this topic, see Litwin (1995); Streiner and Norman (1989); Tulsky (1990).
Bias
Bias can be defined as “any process at any stage of inference which tends to produce results or conclusions that differ systematically from the truth” (Sackett, 1979). Throughout the survey process, there is the potential for bias to be introduced. It is possible for a survey measure to be reasonably valid (measuring the right thing) and reasonably reliable (free of random error), but still subject to serious bias (producing ‘readings’ that are systematically too high or too low). Notice that ‘bias’ is a property of methods or procedures, not a property of individual data sets. Survey data sets which are produced using unbiased methods will still not, in general, exactly reflect the population from which they are drawn, particularly if samples are small, because of the random variance that is inherent in sampling and measurement procedures.
Other potential sources of error
Having introduced the ideas of (in)validity, (un)reliability and bias, we next consider in more detail the ways in which they can arise in quantitative surveys. Key sources of potential error in survey research (some may also occur in other types of enquiry) are listed below. Some are likely to give rise to systematic error (bias); others are more likely to cause random error or ‘noise’.
- Faulty problem definition – this arises from looking at the ‘wrong’ problem or issue, or only looking at part of the issue. For example, low uptake of cervical screening may prompt a survey into women’s beliefs about and attitudes to smear tests. But health beliefs and attitudes may only be part of the picture – low uptake may also reflect difficulties of access, relating to the time and location of clinics and therefore requiring collection of data on behaviour (for example, how people travel to the clinic) and attributes (for example, car ownership, employment status, working hours).
- Surrogate information error – this is caused by a mismatch between the information really required to address the research aims and the information sought by the researcher for reasons of practicality or convenience. For example, it can arise where past behaviour is used as a surrogate for future behaviour, or where information on behavioural intentions is used as a surrogate for evidence on actual behaviour.
- Defective definition of the study population – this occurs when the study population is not clearly defined in terms of the research aims and objectives. For example, if the aim is to measure access to a general practice surgery, the population of interest are all patients registered with that practice. A questionnaire survey administered on practice premises to those attending for appointments would miss an important section of this population, and would almost certainly be biased in favour of those with fewer access problems (but more health problems).
- Sampling frame not representative of population – if the frame or list from which the sample is drawn is not an adequate representation of the underlying population, sampling frame bias will occur. For example, electoral registers considered as a listing of the population ‘all adults who reside in an area’ typically under-represent students and other ‘floating citizens’ who have not registered to vote, or who are ineligible to vote (for example, the homeless, foreign nationals etc.).
- Selection error – this may arise where a non-probability method of sampling (that is, a method which does not give each member of the underlying population a known chance of being included) is used. For example, ‘invited’ samples, such as reader surveys carried out by a journal, are typically non-representative; the readership of even a professional journal is unlikely to be truly representative of all members of that profession, and those who opt to respond to a questionnaire in the journal may be those with particularly strong views one way or the other.
- Non-response error – this is one of the most significant sources of error in survey research, since few, if any, voluntary surveys achieve a true response rate that is close to 100%. Results of surveys with a poor response rate have reduced precision because the sample size is then lower than intended, so that the confidence intervals around any estimates of population parameters (for example mean age or percentage holding a particular opinion) are widened. Shortfalls due to non-response can be avoided by over-sampling, but poor response rates are also likely to be a source of bias, since non-respondents tend to differ from respondents in systematic ways that are relevant to the purpose of the enquiry. For example, people who are too busy to take part in a survey are likely to differ in terms of life-cycle stage and in many aspects of their behaviour and attitudes from people who have plenty of time to spare. Over-sampling cannot cure this.
- Auspices / sponsorship bias – while it is generally considered sound ethical practice to declare who is responsible for commissioning and conducting a survey, respondents’ behaviour, both in terms of decisions of whether or not to respond and in respect of the answers given, may be coloured by knowledge of the sponsors. For example, the wish to be polite and not appear ungrateful, or concerns about the repercussions for their treatment, may lead patients to rate their satisfaction with health care more highly when a survey is being conducted by their doctors than they would if it were being carried out by independent researchers. Similarly, in consumer surveys, respondents’ reports of purchasing behaviour may be altered by the identity of the survey sponsors (e.g. over-reporting of the use of that company’s products relative to those of competitors).
- Interviewer effects – in surveys administered by interviewers, either face-to-face with respondents or over the telephone, the interaction between interviewer and respondent may affect the quantity and quality of response; in surveys with multiple interviewers, observed differences in response patterns may be an artefact of the survey being administered by different interviewers (i.e. poor between-rater reliability) rather than a reflection of true underlying differences between respondents. Different interviewers may pose questions in subtly different ways or may prompt, probe or record responses to a greater or lesser extent. More fundamentally, interviewer characteristics and behaviour may affect response rates, which in turn affects the characteristics of the sub-samples actually interviewed by different interviewers. These two interviewer effects combined may be particularly damaging where each interviewer works in his / her own area, so that what appear to be differences between areas are actually due partly to differences in interviewer performance or characteristics.
- Measurement error – a poorly worded question and / or set of response categories may produce a distorted version of the variable that the researcher intends to measure (a version of invalidity – see above). As we have seen above, it is important to be clear about what type of information is to be gathered and to pose the question appropriately (see Chapters 5, 6 and 9).
- Response bias – the content and wording of questions, and their associated response categories, may lead to distortion and bias in respondents’ answers. Potential problems include:-
- recall bias – in questions involving memory, errors of omission and of telescoping (misplacing an event in time) may occur;
- estimation bias – particularly under pressure, many individuals have difficulties in estimating, calculating and extrapolating quantitative information (for example, in working out annual or monthly consumption patterns);
- social desirability bias – in questions on behaviour and attitudes in particular, the desire to appear in a good light may cause respondents to distort their answers, for example to under-report socially undesirable behaviour such as excessive alcohol consumption.
Response bias is particularly likely to arise where respondents are asked questions that are vague or call for information that they do not have readily available. In such cases they tend to look for clues in the wording of the question and any predetermined response categories as to what sorts of answers they are expected to give (we will return to this in Chapter 6).
- Data recording and processing error – at each stage in recording, coding, entering and validating data, errors may arise; responses may be incorrectly recorded (for example, a word descriptor circled instead of the corresponding code number) or figures may be transposed in recording or entering data (for example, 213 instead of 231).
- Data analysis error – errors may occur both in the transformation of data (for example, in combining responses to two or more questions to yield an aggregate measure of behaviour, belief or attitude) and in applying statistical techniques (for example, choosing tests that are inappropriate to the data).
- Interpretation error – as with data analysis, an imperfect understanding of the statistical techniques may lead to the findings being misinterpreted. In particular, in observational/non-experimental study designs (and most surveys fall into this category), it is extremely dangerous to infer causal relationships from observed associations (correlation between variables) without developing and testing a theory leading to explicit hypotheses as to what associations would (or would not) be expected if the hypothesis were valid.
In the real world of survey research, total elimination of error and bias is impossible. Fortunately, in most applications a limited amount of estimation error can be tolerated, particularly if the limits of error can themselves be estimated. However, the survey researcher must be aware of the potential for error and, at each step in the survey process, must take steps to minimise the threat. In the sections that follow, methods for reducing bias and error are discussed in greater detail.
Minimising survey error to achieve high data quality
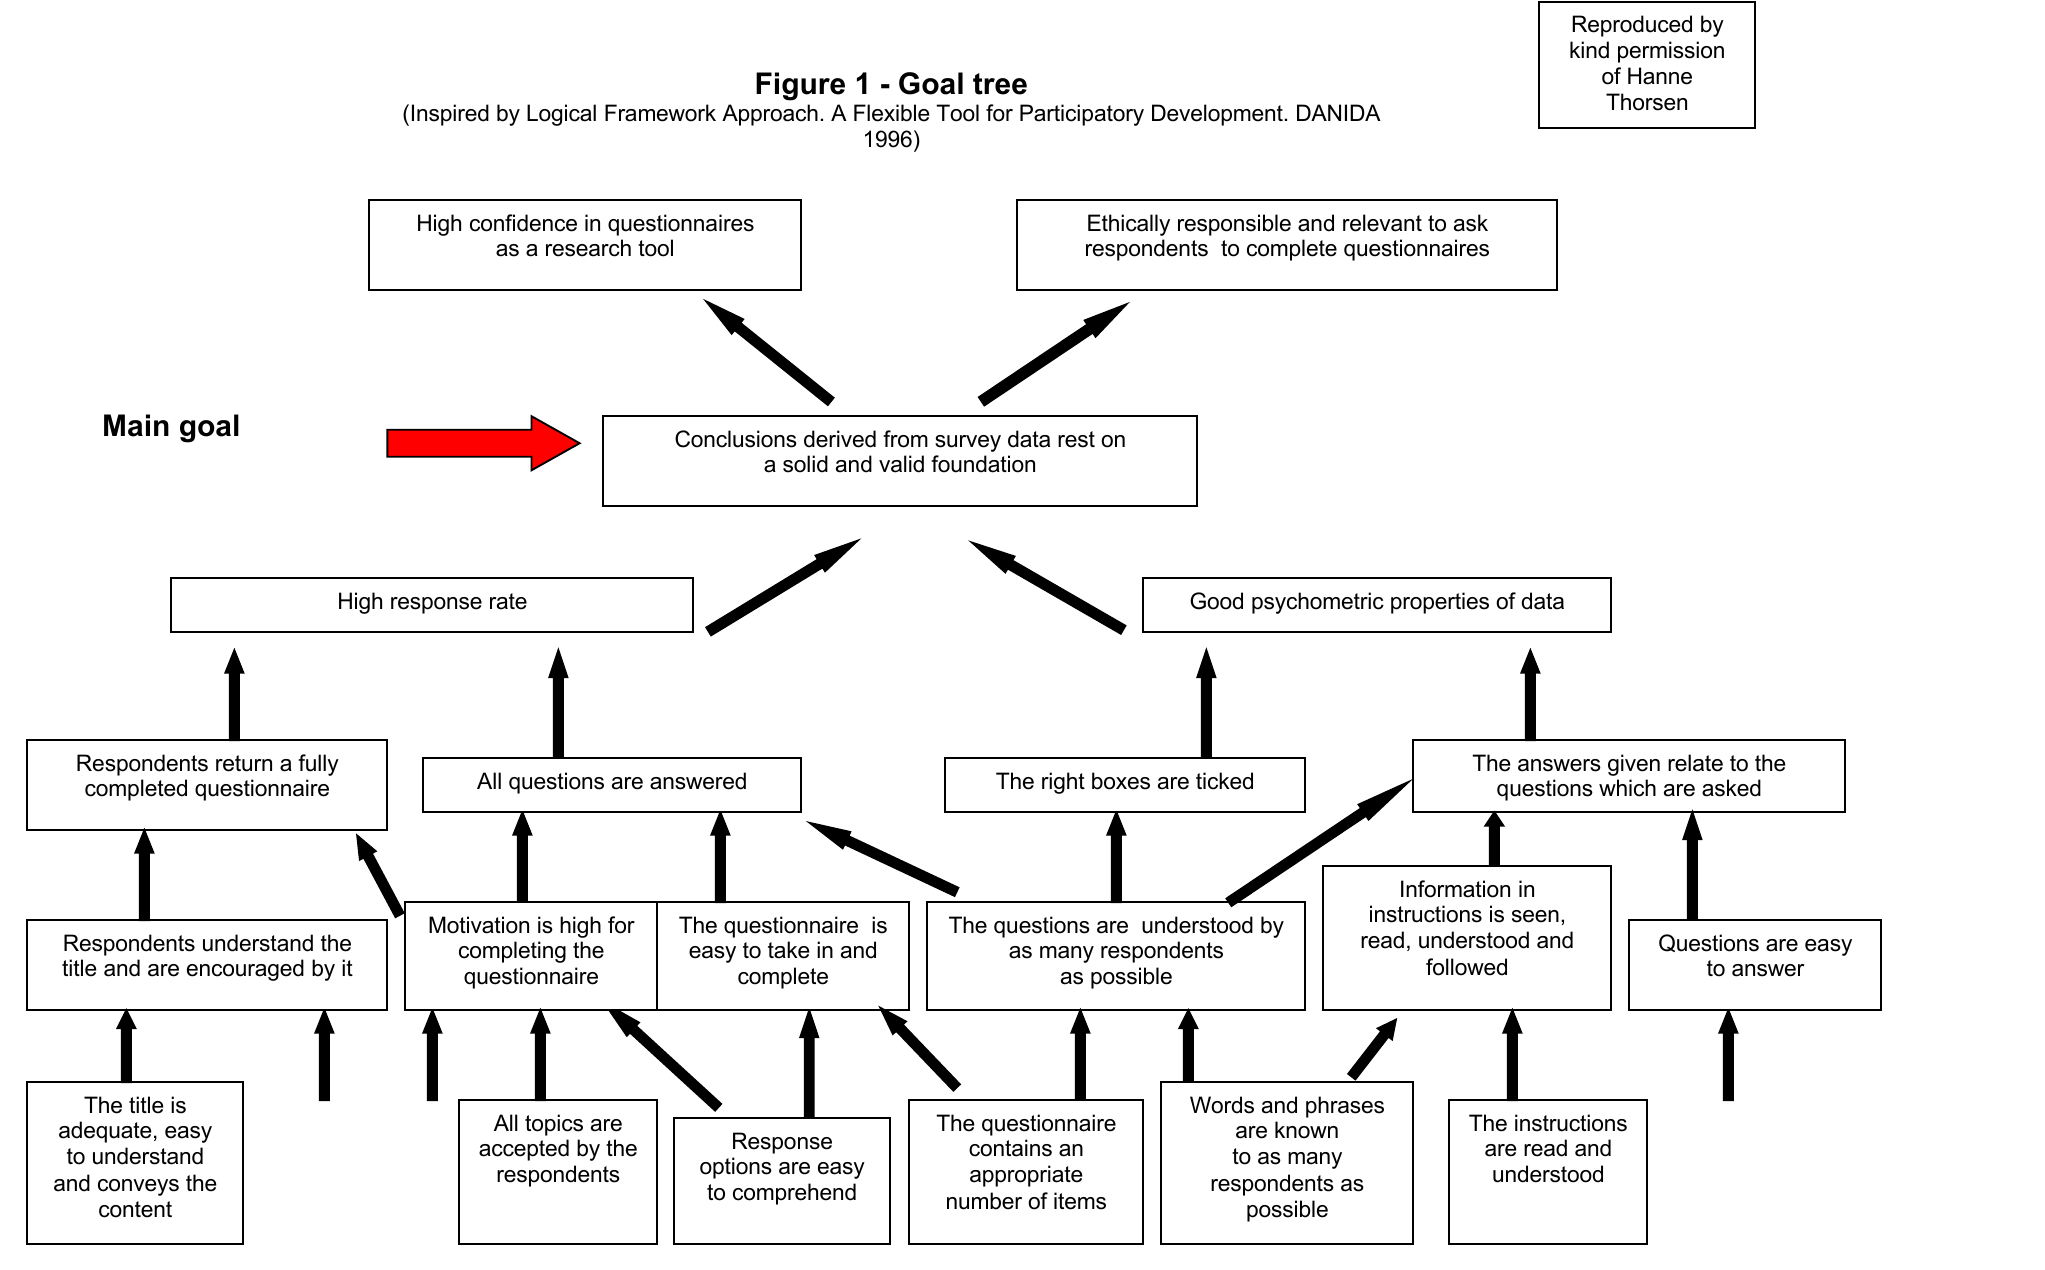
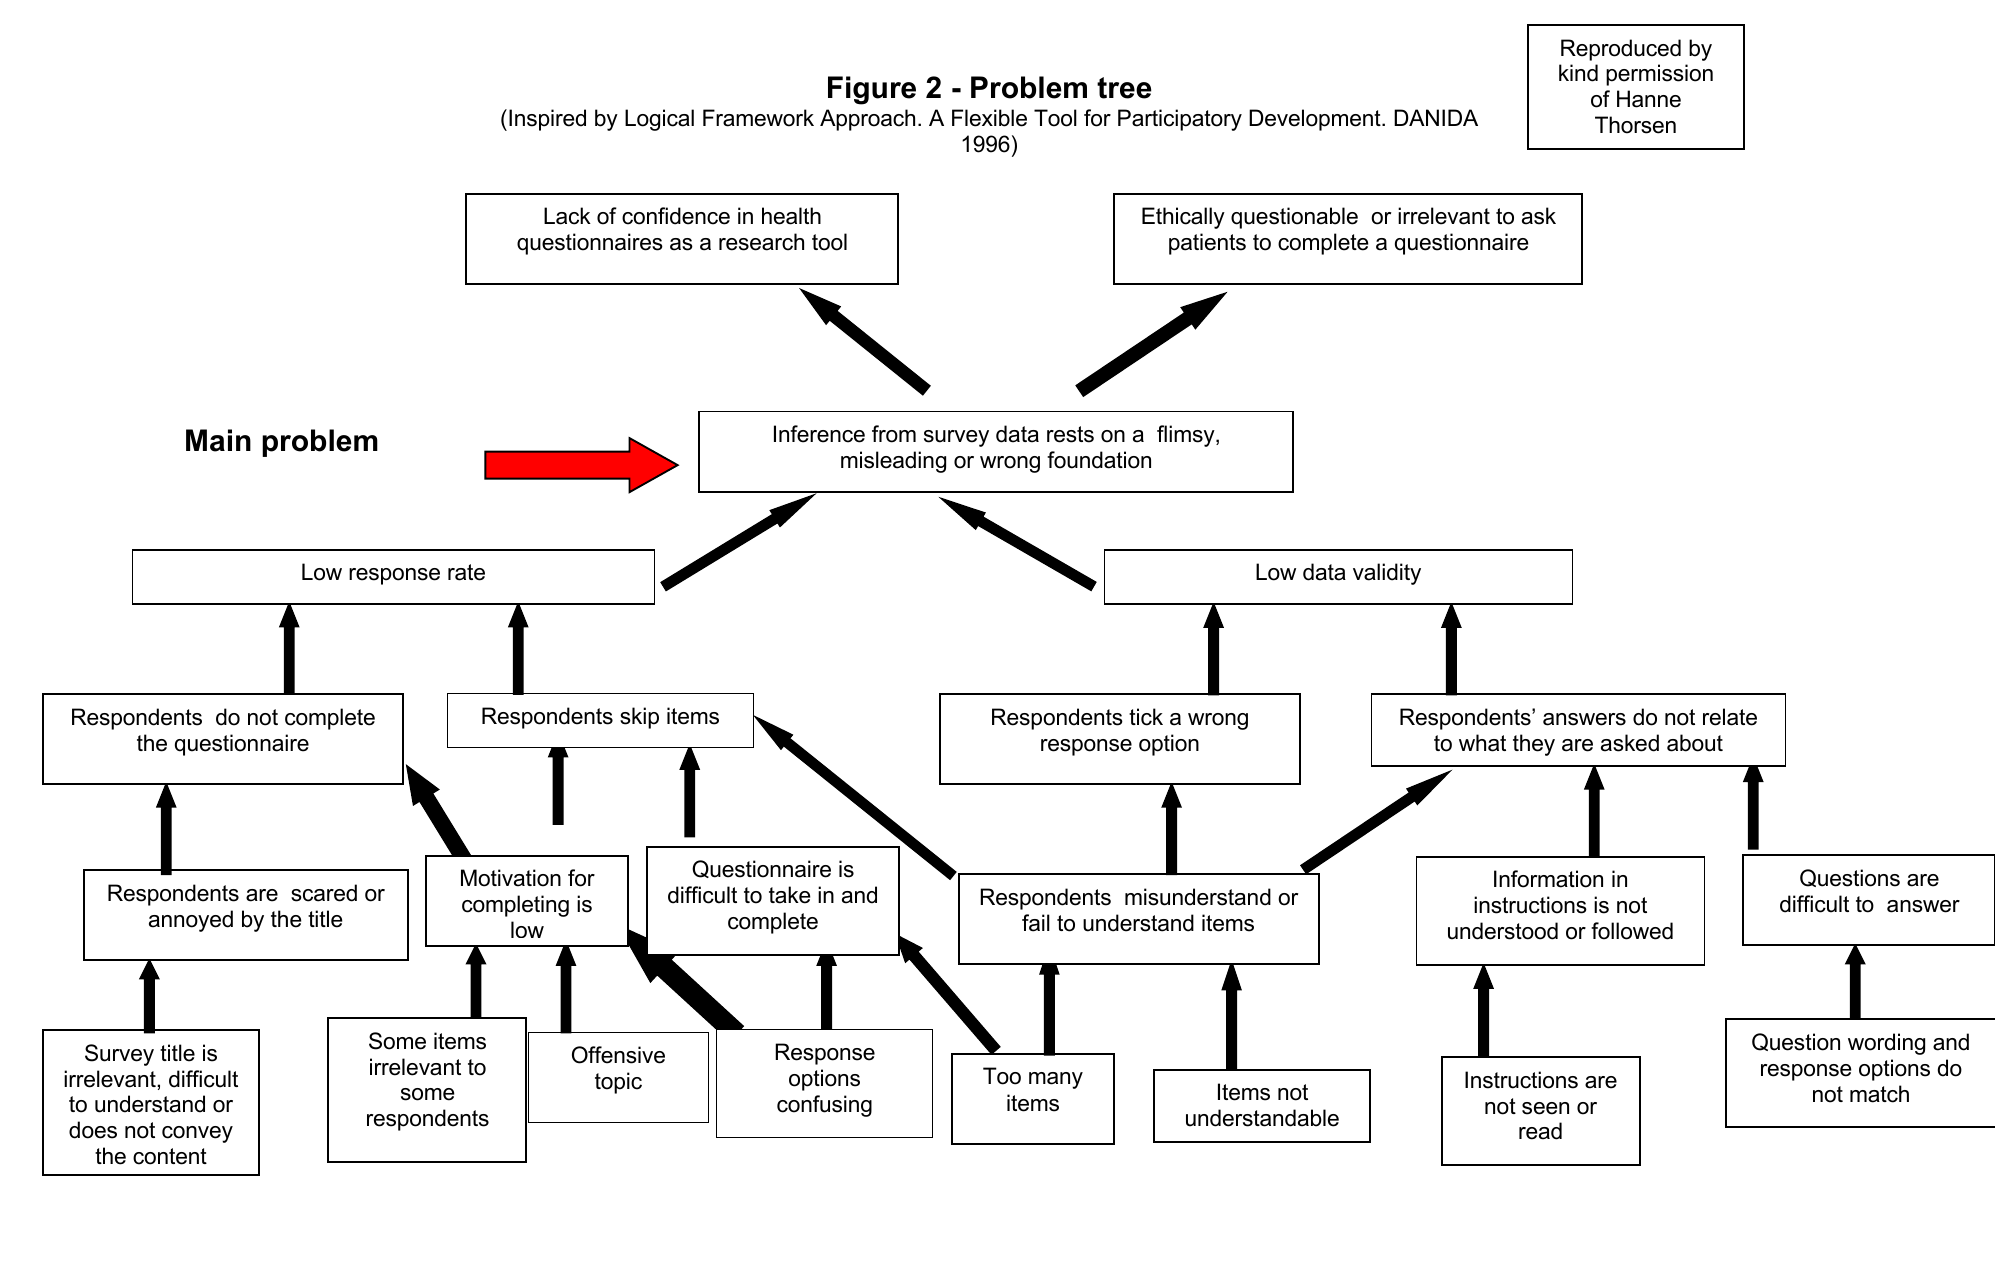
As identified above, the aim of the survey researcher is to collect high quality measures of the target concepts and variables – in other words, measures that are valid, reliable, sufficiently sensitive for their purpose, and free from mistakes, with systematic bias and inherent random error due to sampling and measurement kept to a minimum. But, as we have already seen, at each stage in the survey process, threats to data quality occur. Figure 1 provides a diagrammatic summary of the goals in survey research, while Figure 2 shows the problems that can arise – these problems must be anticipated and strategies must be put in place to minimise the risk.
For example, if non-probability methods of sampling are used, sampling method bias is likely – the person drawing the sample may consciously or subconsciously select ‘interesting’, easy to find or ‘likely to co-operate’ cases, rather than picking a sample that is truly representative of the underlying population (we will examine this further in Chapter 12). Response bias may occur in answering the questions; respondents may distort the truth to portray themselves in a better light, especially when questions involve value judgements; in questions involving recall, they may omit events or misplace them in time. To ensure high quality data, the survey researcher must pay due attention to the design and conduct of all stages in the survey, as summarised in Box 2 and Table 1.
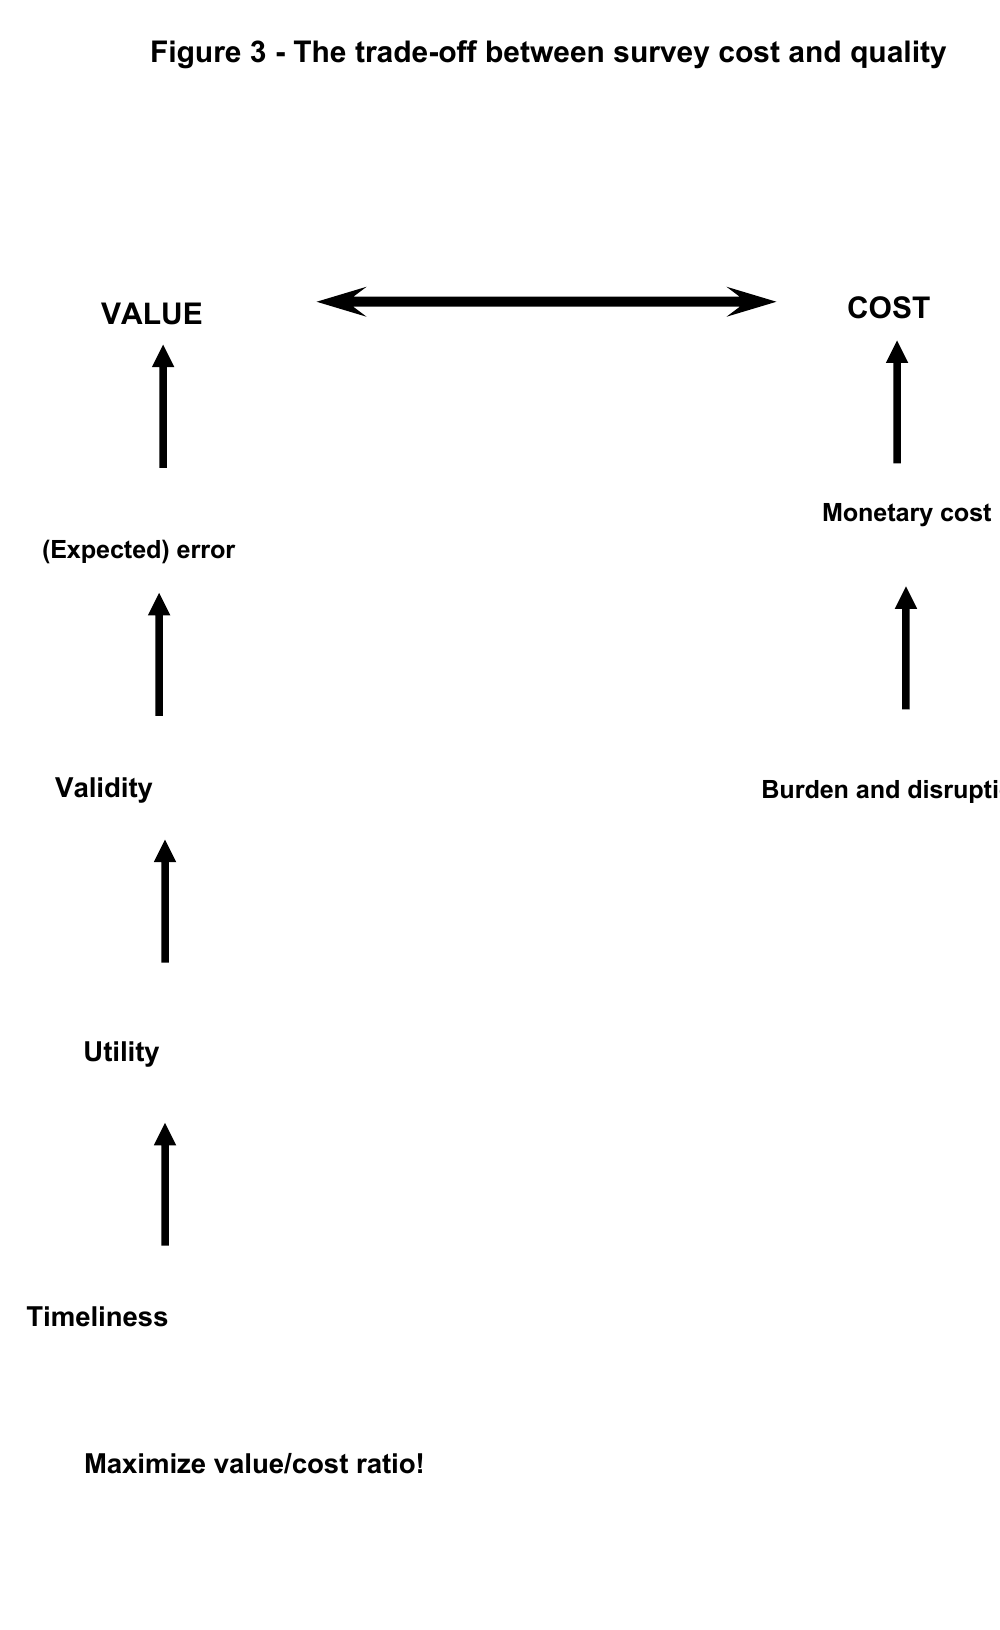
The aim should be “to identify each aspect of the survey process that may influence either the quality or quantity of response and to shape each one of them in such a way that the best possible responses are obtained” (Dillman, 1978, p12). This approach has been termed the “Total Design Method” (Dillman, 1978) or, more recently (Dillman, 2000) the “Tailored Design Method”. But the survey researcher will be faced with scarcity of resources – money, time, personnel. As Lynn (1996) states, surveys must be “value for money” – the value of the information yielded must exceed the cost of obtaining that information (see Figure 3). In some cases, compromises between quality and cost will be necessary; for example, a trade-off between, on the one hand, the increased precision and potential reduction in non-response bias of a larger achieved sample following a third reminder and, on the other hand, the cost of sending that reminder.
Box 2 Ensuring high quality data in survey research
Survey design and sampling
- Clear view of what population the results are intended to represent
- Correct and appropriate design specification
- Adequate sampling frames and sample selection procedures
- Freedom from sampling method bias
Survey measurement
- Measuring the target concept (validity)
- Freedom from measurement bias
- Control of random measurement variability (reliability)
- Adequate measurement sensitivity / discriminatory power
Controlling response behaviour
- Maximising rate of response
- Minimising non-response bias
Good survey management and quality control
- Timeliness
- Robust practicality
- Cost-effectiveness
Excellent execution cannot save a survey if the design does not fit the aims – for example: the actual population sampled does not match the target population; confounding effects are not properly controlled for (experimentally or statistically); the study design cannot support desired comparisons or conclusions; there is an inadequate sample size, causing insufficient precision in drawing conclusions about the population of interest; key measures (including key classificatory variables) are omitted; the questions and procedures used do not adequately capture the variables they are intended to measure. Similarly, excellent design cannot save a survey if: funding is inadequate; human and other resources are inadequate; time allowed is inadequate; project management and quality control are inadequate.
Table 1 Ensuring high quality data in survey research
|
Usefulness / quality factor |
Resource / skill requirement |
|---|---|
|
Good research design skills. Good liaison with sponsor and users. Good analysis and reporting skills. |
|
|
Good total study design |
Good research skills. |
|
Low sampling error / adequate precision of estimates |
Good statistical skills. Adequate sample size. |
|
Low sampling bias |
Good statistical skills. Adequate sampling frame. Good control of the sampling process. |
|
Timely delivery of results |
Good project management. |
|
High rate of response / low non-response bias |
Good postal package design. Minimised response burden. Good project management. |
|
High questionnaire completion rate / low item non-response |
Good questionnaire design – including question wording and layout. |
|
Adequate measurement (validity, reliability, lack of bias, discriminatory power) |
Good question design. |
|
Good process quality – sampling, postal operations, coding, data processing |
Summary of key points
- In survey data collection, errors can occur without anyone having made a mistake – sources include sampling variance, sampling bias, non-response bias and measurement error.
- Survey data collection is also open to threat from mistakes, due to oversights, misunderstandings and slip-ups by those conducting the survey.
- The quality aims in survey data collection are to gather information that is: sufficiently precise; unbiased; valid; reliable; discriminating; free from mistakes and oversights.
- Threats of systematic error (bias) and random error (‘noise’, unreliability) arise at many stages in the survey data process and the survey researcher needs to be aware of the risks and to take appropriate action. However, surveys must be cost-effective, and the quality-cost balance must be carefully considered.
Further reading
Lynn P. Quality and error in self-completion surveys. Survey Methods Centre Newsletter 1996, 16(1), 4-9.
- With the Research Methods Knowledge Database, there is a good section on Measurement at http://www.socialresearchmethods.net/kb/measure.htm which deals with issues of validity and reliability.
Reporting guidance for surveys
As with all types of research, clear and transparent reporting of methods and findings is essential. The following publications are recommended.
Bennett C, Khangura S, Brehaut JC, Graham ID, Moher D, Potter BK and Grimshaw JM (2011). Reporting Guidelines for Survey Research: An Analysis of Published Guidance and Reporting Practices. PLoS Medicine, 8(8): e1001069
Sharma, A., Minh Duc, N., Luu Lam Thang, T. et al. A Consensus-Based Checklist for Reporting of Survey Studies (CROSS) (2021). Journal of General Internal Medicine 36, 3179–3187. https://doi.org/10.1007/s11606-021-06737-1
Current guidance and methodological literature for 2026–27:
- Biemer, P. P. et al.. Total Survey Error in Practice. 2017.
- U.S. Census Bureau. Producing Measures and Indicators of Nonsampling Error. current statistical quality standard.
References
Campbell DT and Fiske DW. Convergent and discriminant validation by the multitrait-multimethod matrix. Psychological Bulletin 1959;56;81-105.
Dillman DA. Mail and telephone surveys: The total design method, New York: John Wiley and Sons, Inc, 1978.
Dillman DA. Mail and internet surveys: the tailored design method. 2nd ed. New York: John Wiley and Sons, Inc., 2000.
Litwin MS. How to measure survey reliability and validity. Thousand Oaks: Sage Publications, 1995.
Lynn P. Quality and error in self-completion surveys. Survey Methods Centre Newsletter 1996;16(1);4-9.
Sackett DL. Bias in analytic research. Journal of Chronic Diseases 1979;32;51-63.
Streiner DL and Norman GR. Health measurement scales: a practical guide to their development and use. Oxford: Oxford University Press, 1989.
Tulsky DS. An introduction to test theory. Oncology 1990;4:43-48.